
Data Visualization Empowering Local Communities

Community-Led Water Quality Monitoring
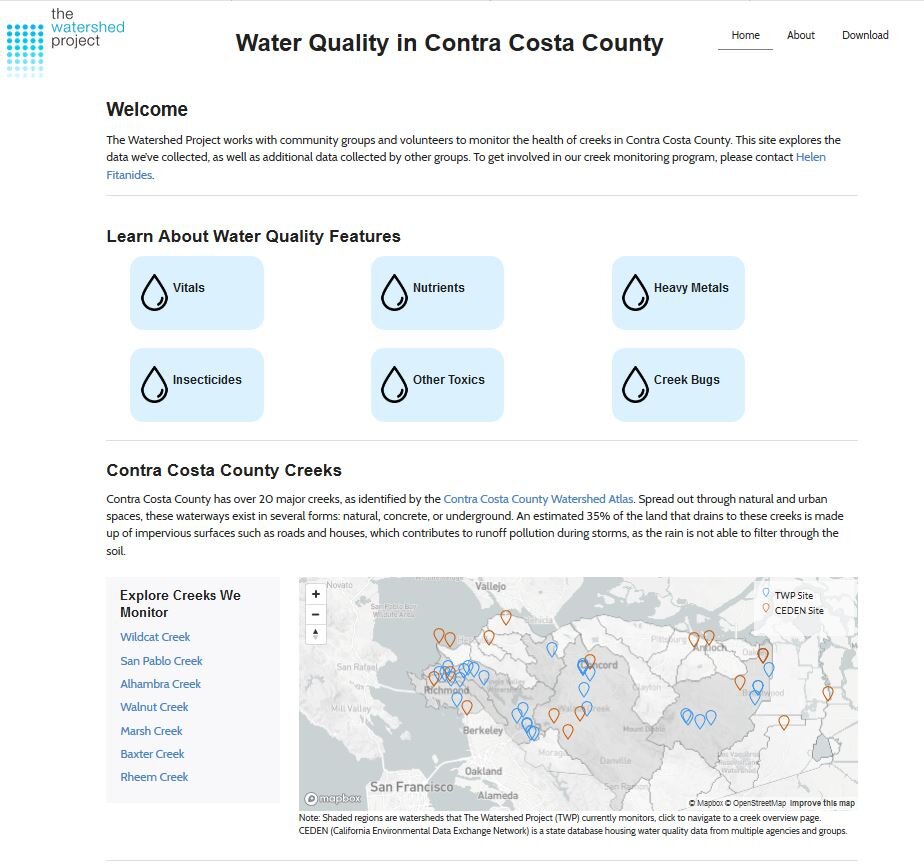
FlowWest partnered with The Watershed Project (TWP) to develop a tool that helps local communities store, manage, and understand the data they collect in their local watershed. TWP supports grassroots watershed organizations and nurtures young people to aspire to environmental careers by engaging with students, teachers and volunteers directly in creek beds and on the shorelines. Based out of Richmond, CA since 1997, TWP is committed to building resiliency, community, and awareness in the Bay Area by bringing a watershed perspective to the urban environment.
Engaging Our Neighbors
The Citizen Science Water Quality Web Application (the app, https://app.thewatershedproject.org/) explains basic water quality concepts and provides a watershed scorecard so community members can quickly and easily assess their watershed’s water quality health. Users of the app can explore the water quality sampling sites within their watershed through interactive plots that illustrate each parameter and the safe thresholds. Armed with local water quality data, community organizers and watershed stewards can work with city, county, state, and federal agencies to implement restoration and urban greening projects to improve water quality conditions in their watersheds.

Easy to use
Although only recently developed, the app has already been used to showcase results from watershed education programs run by TWP for students in elementary (Kids in Creeks - Grades 2-4) and middle/high school (From Me to the Sea - Grades 6-12). Data collected by student citizen scientists is uploaded to the app and allows students to draw connections between the data they collected and previous data collected by other student scientists.


